
The science
AI carbon numbers you can defend.
Spend-based estimates miss by up to 12×.
Most inventories put AI inside a generic IT spend line. It can't tell one model or one region from another, and nobody can reduce what they can't see.
Spend-based, today
Euros × an IT-sector factor
- 1.7 to 12.3 times the physical estimate
- Same number for a small model and a frontier one
- Same number in Sweden and in Singapore
Token-based, AI4AI
Tokens × a factor per model and region
- Built from public benchmarks and grid data
- Separates models, regions and providers
- Every input sourced, versioned and open
How the method works
From a token count to a line in your inventory.
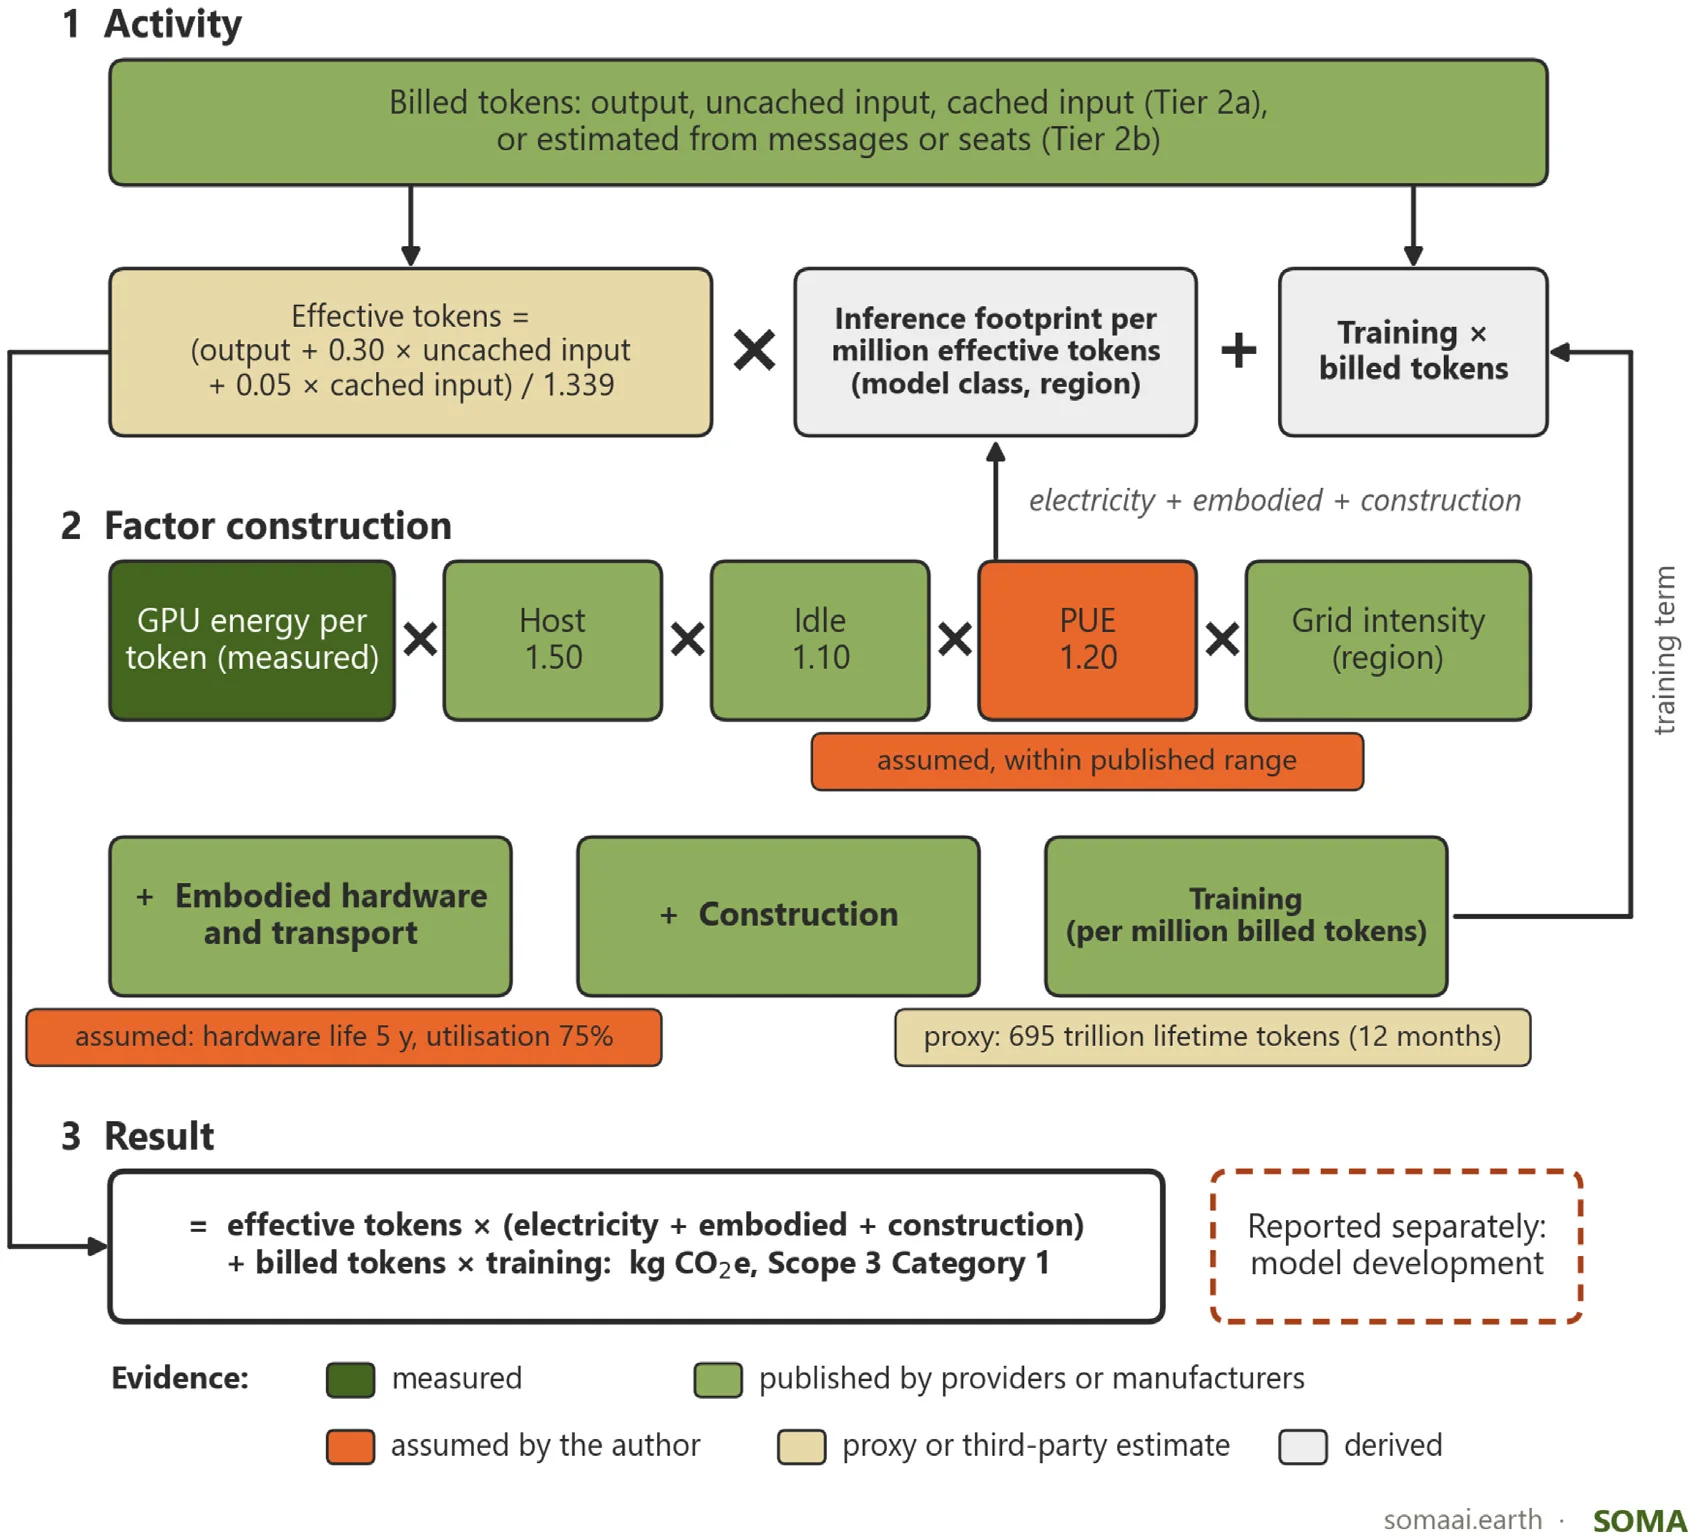
- 1
Start from what you were billed.
Token counts from the provider invoice. When a tool only shows seats or messages, the method estimates tokens from them and says so.
- 2
Build the factor from public evidence.
Benchmarked GPU energy per token, server overhead, data-centre efficiency and the grid of the cloud region. Then hardware, construction and model training on top.
- 3
Report one line an auditor can follow.
kg CO2e in Scope 3 Category 1, with electricity and water beside it. Every input is tagged as measured, published, assumed or derived.
The model and the region decide the number.
12×
between model classes
The same question costs about twelve times more carbon on a frontier model than on a small one.
9×
between cloud regions
The grid behind the data centre changes the figure as much as the model does.
0.039 kg
CO2e per million tokens
A mid-size model on the world-average grid. The starting point, not the answer.
Worked examples from the paper
8.5 kg
CO2e a year for a 200-person company
2.1 t
CO2e a year for 50 developers with AI coding agents, mid-size model
8.3 t
The same team on a frontier model
Start with what you have. Climb when you can.
The tier follows the data each tool gives you, mapped to the GHG Protocol data-quality hierarchy that ESRS E1 asks for.
Tier 1
Spend
Euros spent times an IT-sector factor. A screening figure only.
Tier 2b
Seats and messages
Tokens estimated from what the admin console shows.
Tier 2a
Exact tokens
Token counts from the billing export, times the factor for that model and region.
Tier 3
Provider certified
A figure the provider metered for your account. Used as is.
Less precise → more precise